Quantitative Evaluation
Core metrics comparison between LLMs, baseline (Mirofish) and NEXUS, with supporting visualizations.
Table 1. Core Metrics – LLMs and Systems
| System | EIS | Report Quality | Hallucination Risk | Relevance | Novelty | Grounding |
|---|---|---|---|---|---|---|
| GPT-4o | - | 0.2929 | - | 0.2016 | 0.3222 | - |
| o1-preview | - | 0.2443 | - | 0.2568 | 0.9331 | - |
| qwen-max | - | 0.2538 | - | 0.1728 | 0.4096 | - |
| deepseek-chat | - | 0.2688 | - | 0.1323 | 0.8928 | - |
| Mirofish | 0.5602 | 0.4861 | 0.5042 | 0.517 | 0.8932 | 0.51 |
| NEXUS | 0.6631 (+18.36%) | 0.5216 (+7.29%) | 0.4852 (-3.78%) | 0.5418 (+4.79) | 0.9774 (+9.4360%) | 0.5367 (+5.23%) |
“-” denotes missing. NEXUS % vs Mirofish. Green↑=gain, Red↓=reduction. (num digits omitted)
Table 2. Retrieval & Multi‑Agent Metrics
| Metric | Mirofish | NEXUS | Absolute (pct) | Metric | Mirofish | NEXUS | Absolute (pct) |
|---|---|---|---|---|---|---|---|
| RETRIEVAL & MULTI‑AGENT | |||||||
| retrieval_quality | 0.862 | 0.8848 | +0.0228 +2.65% | multi_agent_quality | 0.6035 | 0.6302 | +0.0267 +2.67% |
| evidence_density | 0.7188 | 0.7321 | +0.0133 +1.85% | agent_agreement | 0.6693 | 0.6922 | +0.0228 +3.41% |
| evidence_per_claim | 0.3333 | 0.3448 | +0.0114 +3.43% | agent_disagreement_risk | 0.8056 | 0.7675 | -0.0381 -4.73% |
| retrieval_risk | 0.1398 | 0.1094 | -0.0305 -21.80% | agent_query_relevance | 0.5 | 0.5533 | +0.0533 +10.66% |
| multi_agent_confidence | 0.7739 | 0.8005 | +0.0267 +2.67% | ||||
Green↑=gain, Red↓=reduction. Some cells two lines: absolute change & percentage. (num digits omitted)
Table 3. Knowledge Graph & Insight Report Metrics
| Metric | Mirofish | NEXUS | Absolute (pct) | Metric | Mirofish | NEXUS | Absolute (pct) |
|---|---|---|---|---|---|---|---|
| KNOWLEDGE GRAPH & INSIGHT REPORT | |||||||
| kg_quality | 0.352 | 0.682 | +0.33 +93.74% | insight_quality | 0.4861 | 0.5216 | +0.0354 +7.30% |
| kg_risk | 0.3783 | 0.3364 | -0.0419 -11.07% | insight_hallucination risk | 0.5042 | 0.4852 | -0.0190 -3.78% |
| relation_consistency | 0.7217 | 0.7901 | +0.0683 +9.47% | relevance | 0.517 | 0.5418 | +0.0248 +4.80% |
| claim_structurality | 0.1565 | 0.1946 | +0.0381 +24.34% | grounding | 0.51 | 0.5367 | +0.0267 +5.24% |
| graph_density_proxy | 0.5031 | 0.6376 | +0.1345 +26.73% | report_coherence | 0.0649 | 0.8648 | +0.7999 +1233.42% |
| graph_reasoning_signal | 0.3091 | 0.3396 | +0.0305 +9.86% | report_length_score | 0.1667 | 0.407 | +0.2404 +144.23% |
| path_reasoning | 0.2789 | 0.3056 | +0.0267 +9.56% | report_quality | 0.1919 | 0.4001 | +0.2082 +108.48% |
| additional_supplement_signal | - | 0.3503 | +0.3503 - | report_query_alignment | 0.0763 | 0.0771 | +0.0008 +1.06% |
| confidence_signal | 0.0343 | 0.0343 | +0.0343 - | report_structure_quality | 0.5034 | 0.8556 | +0.3522 +69.97% |
| confidence_signal (dup) | - | - | +69.97% | ||||
“-” zero/missing. Duplicate preserved as original. (num digits omitted)
📊 Figure 1. 指标分布图 (distribution_figure)
点击图片放大
🛰️ Figure 2. 分组雷达图 (radar_grouped_academic)
点击图片放大
📈 Figure 3. 稳定性分析图 (stable_figure)
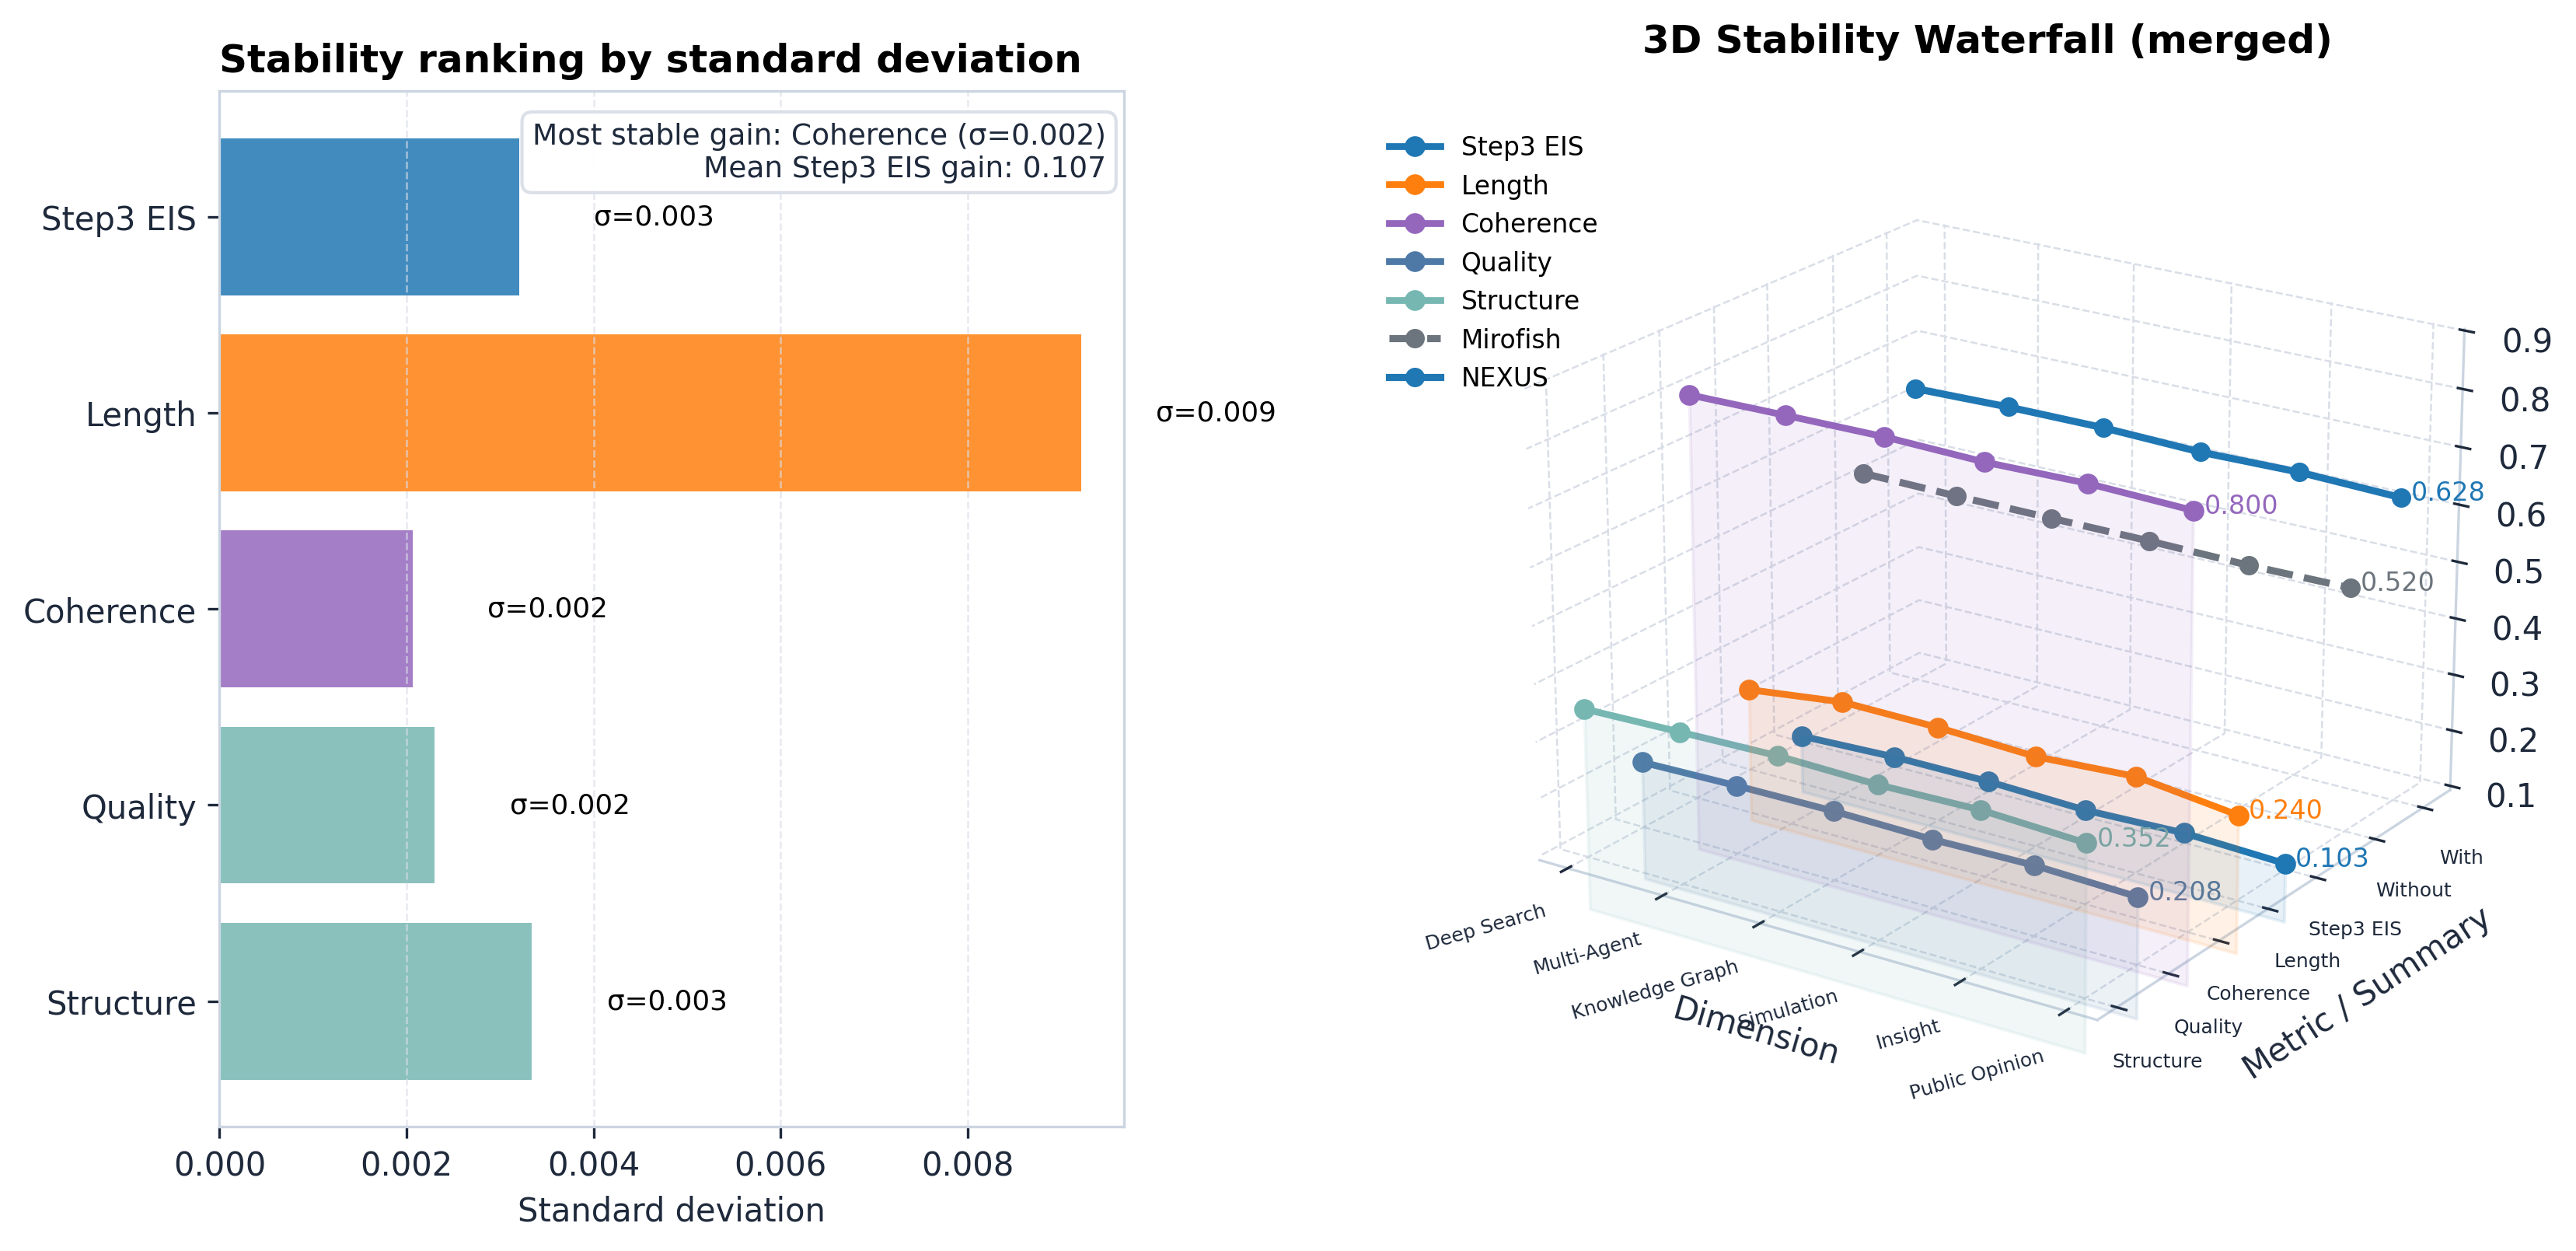
点击图片放大